
talk by split
experimentleaks.com
use data to drive the decisions. A/B testing, multivariant – controlled experiments reduce external influences. it can allow us to distinguish from noise and real signal.
measure ‘statistically significant’ detecting something meaningful.
errors: false positives + false negatives

design like you are right, test like you are wrong.

How to run an experiment:
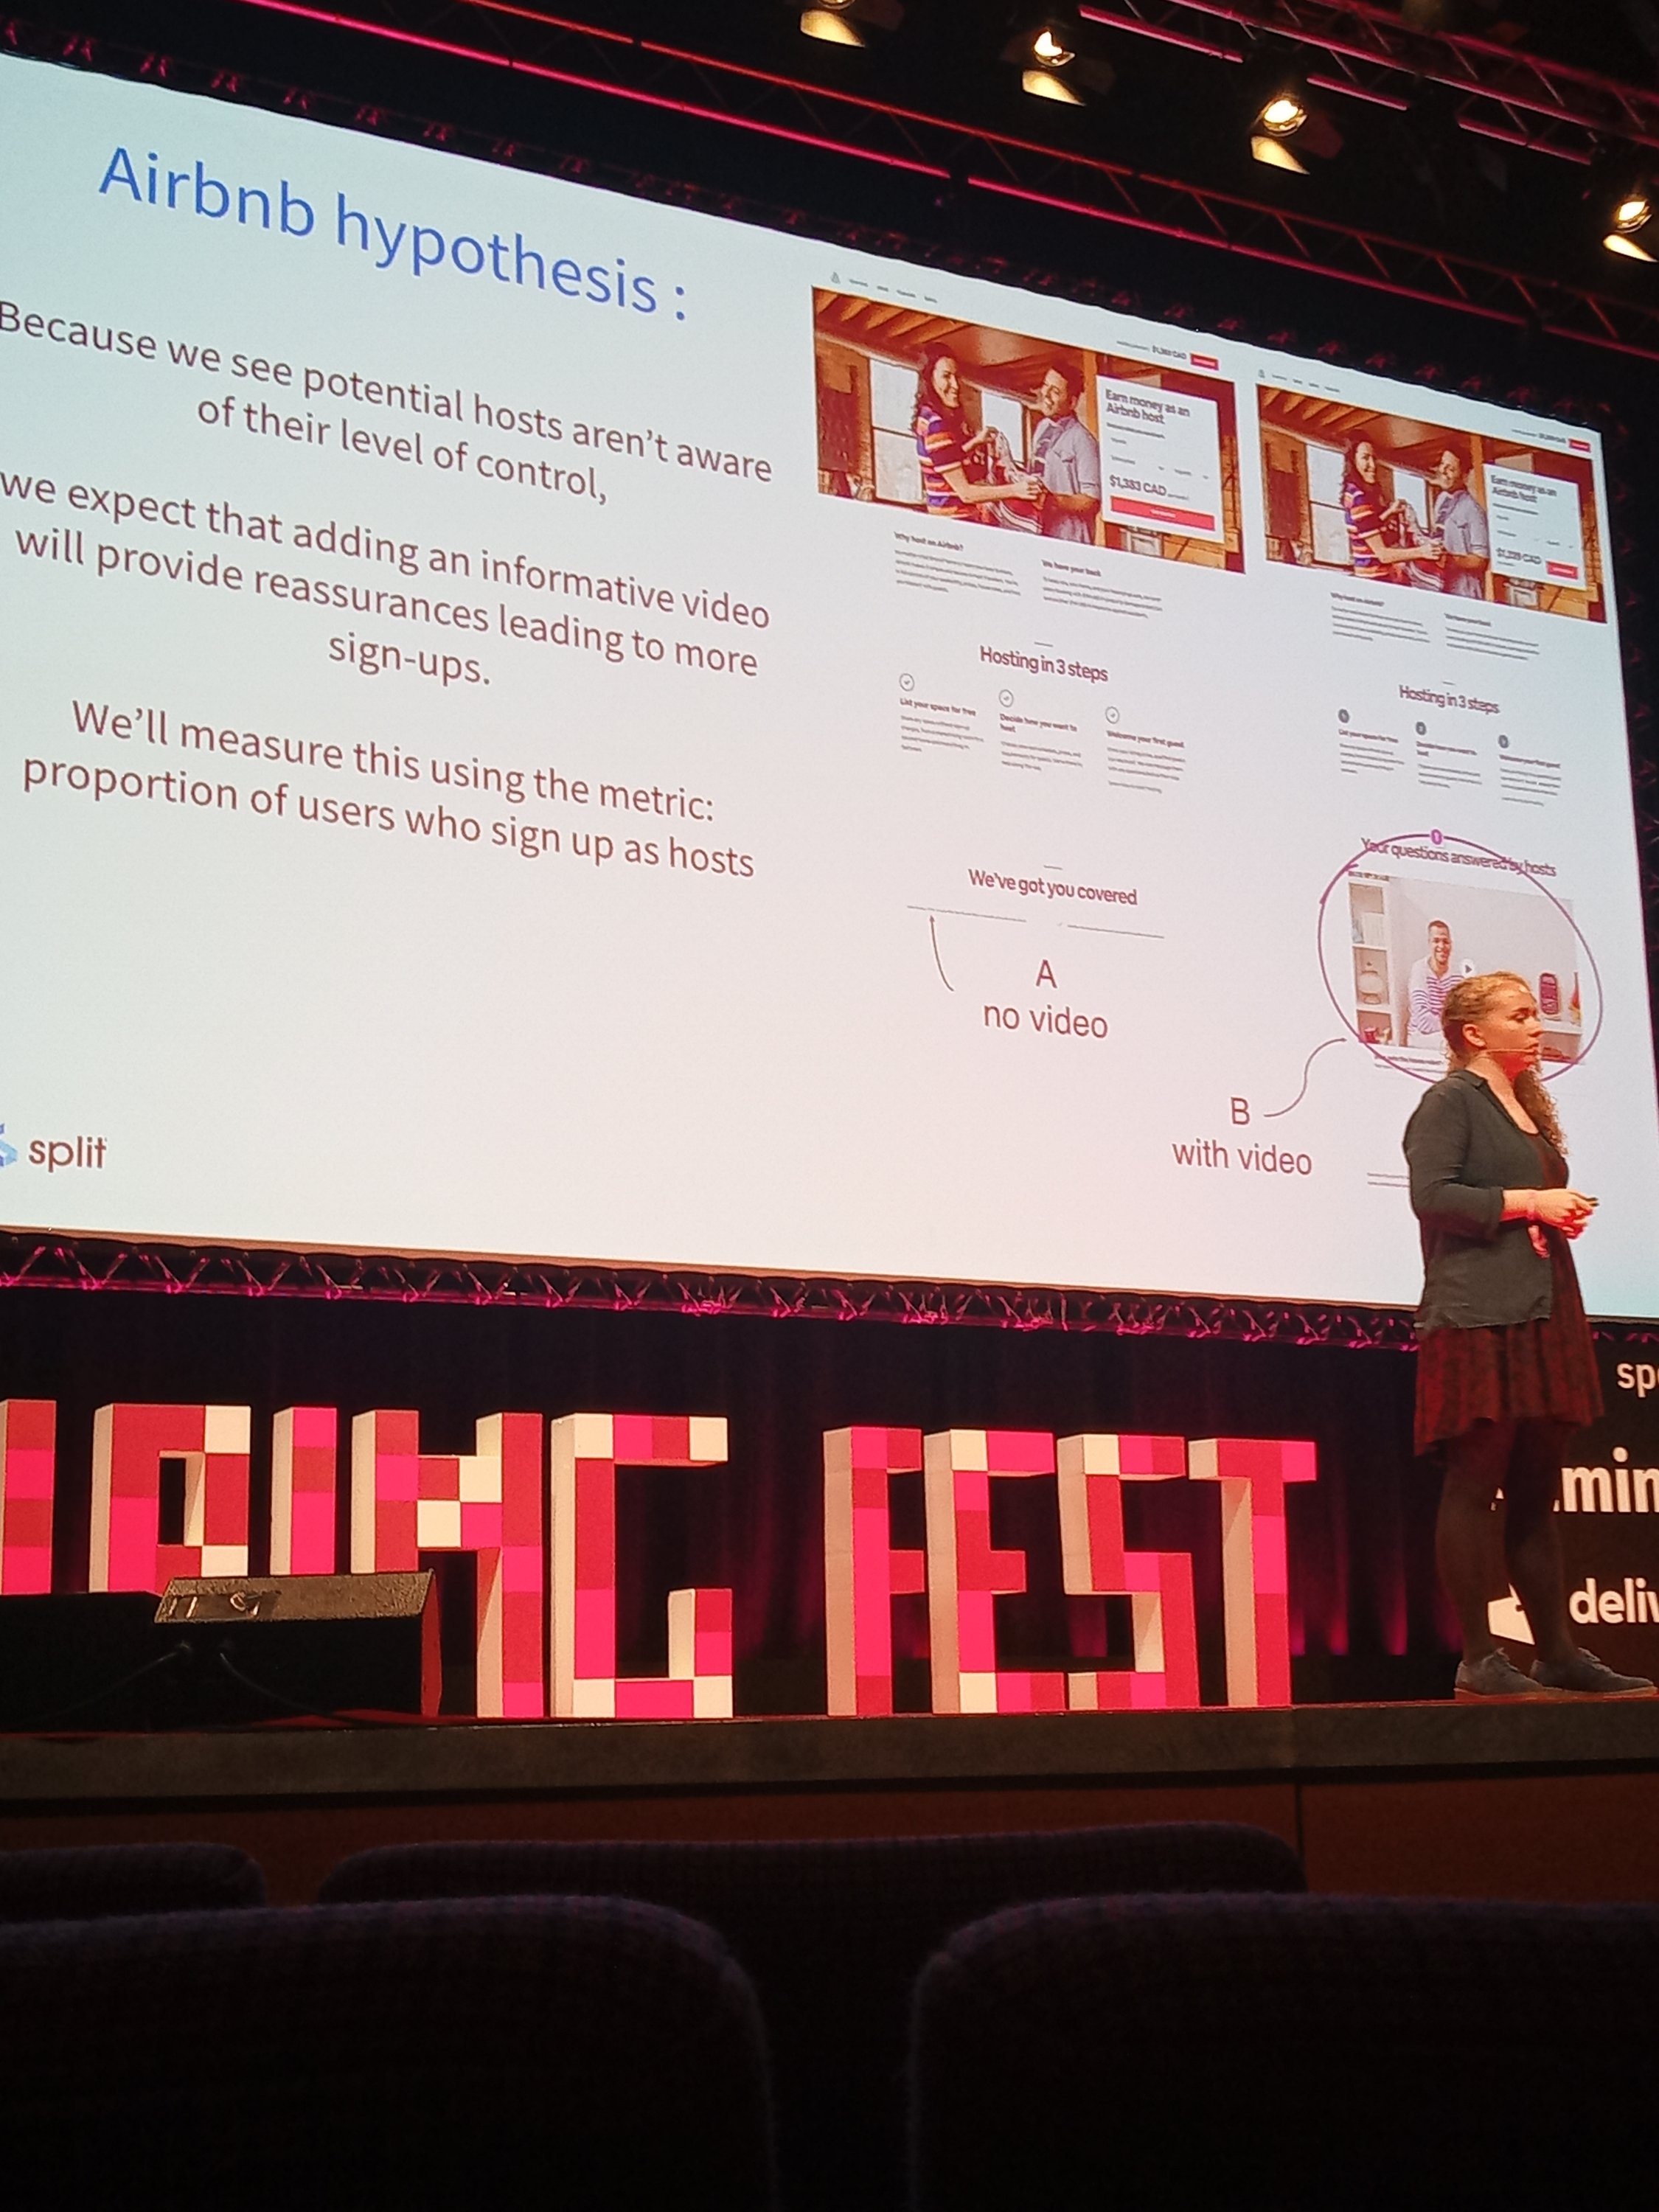
make a hypothesis, expected results, pick metrics – the standard scientific method.
lick the correct timeframe for the experiments.
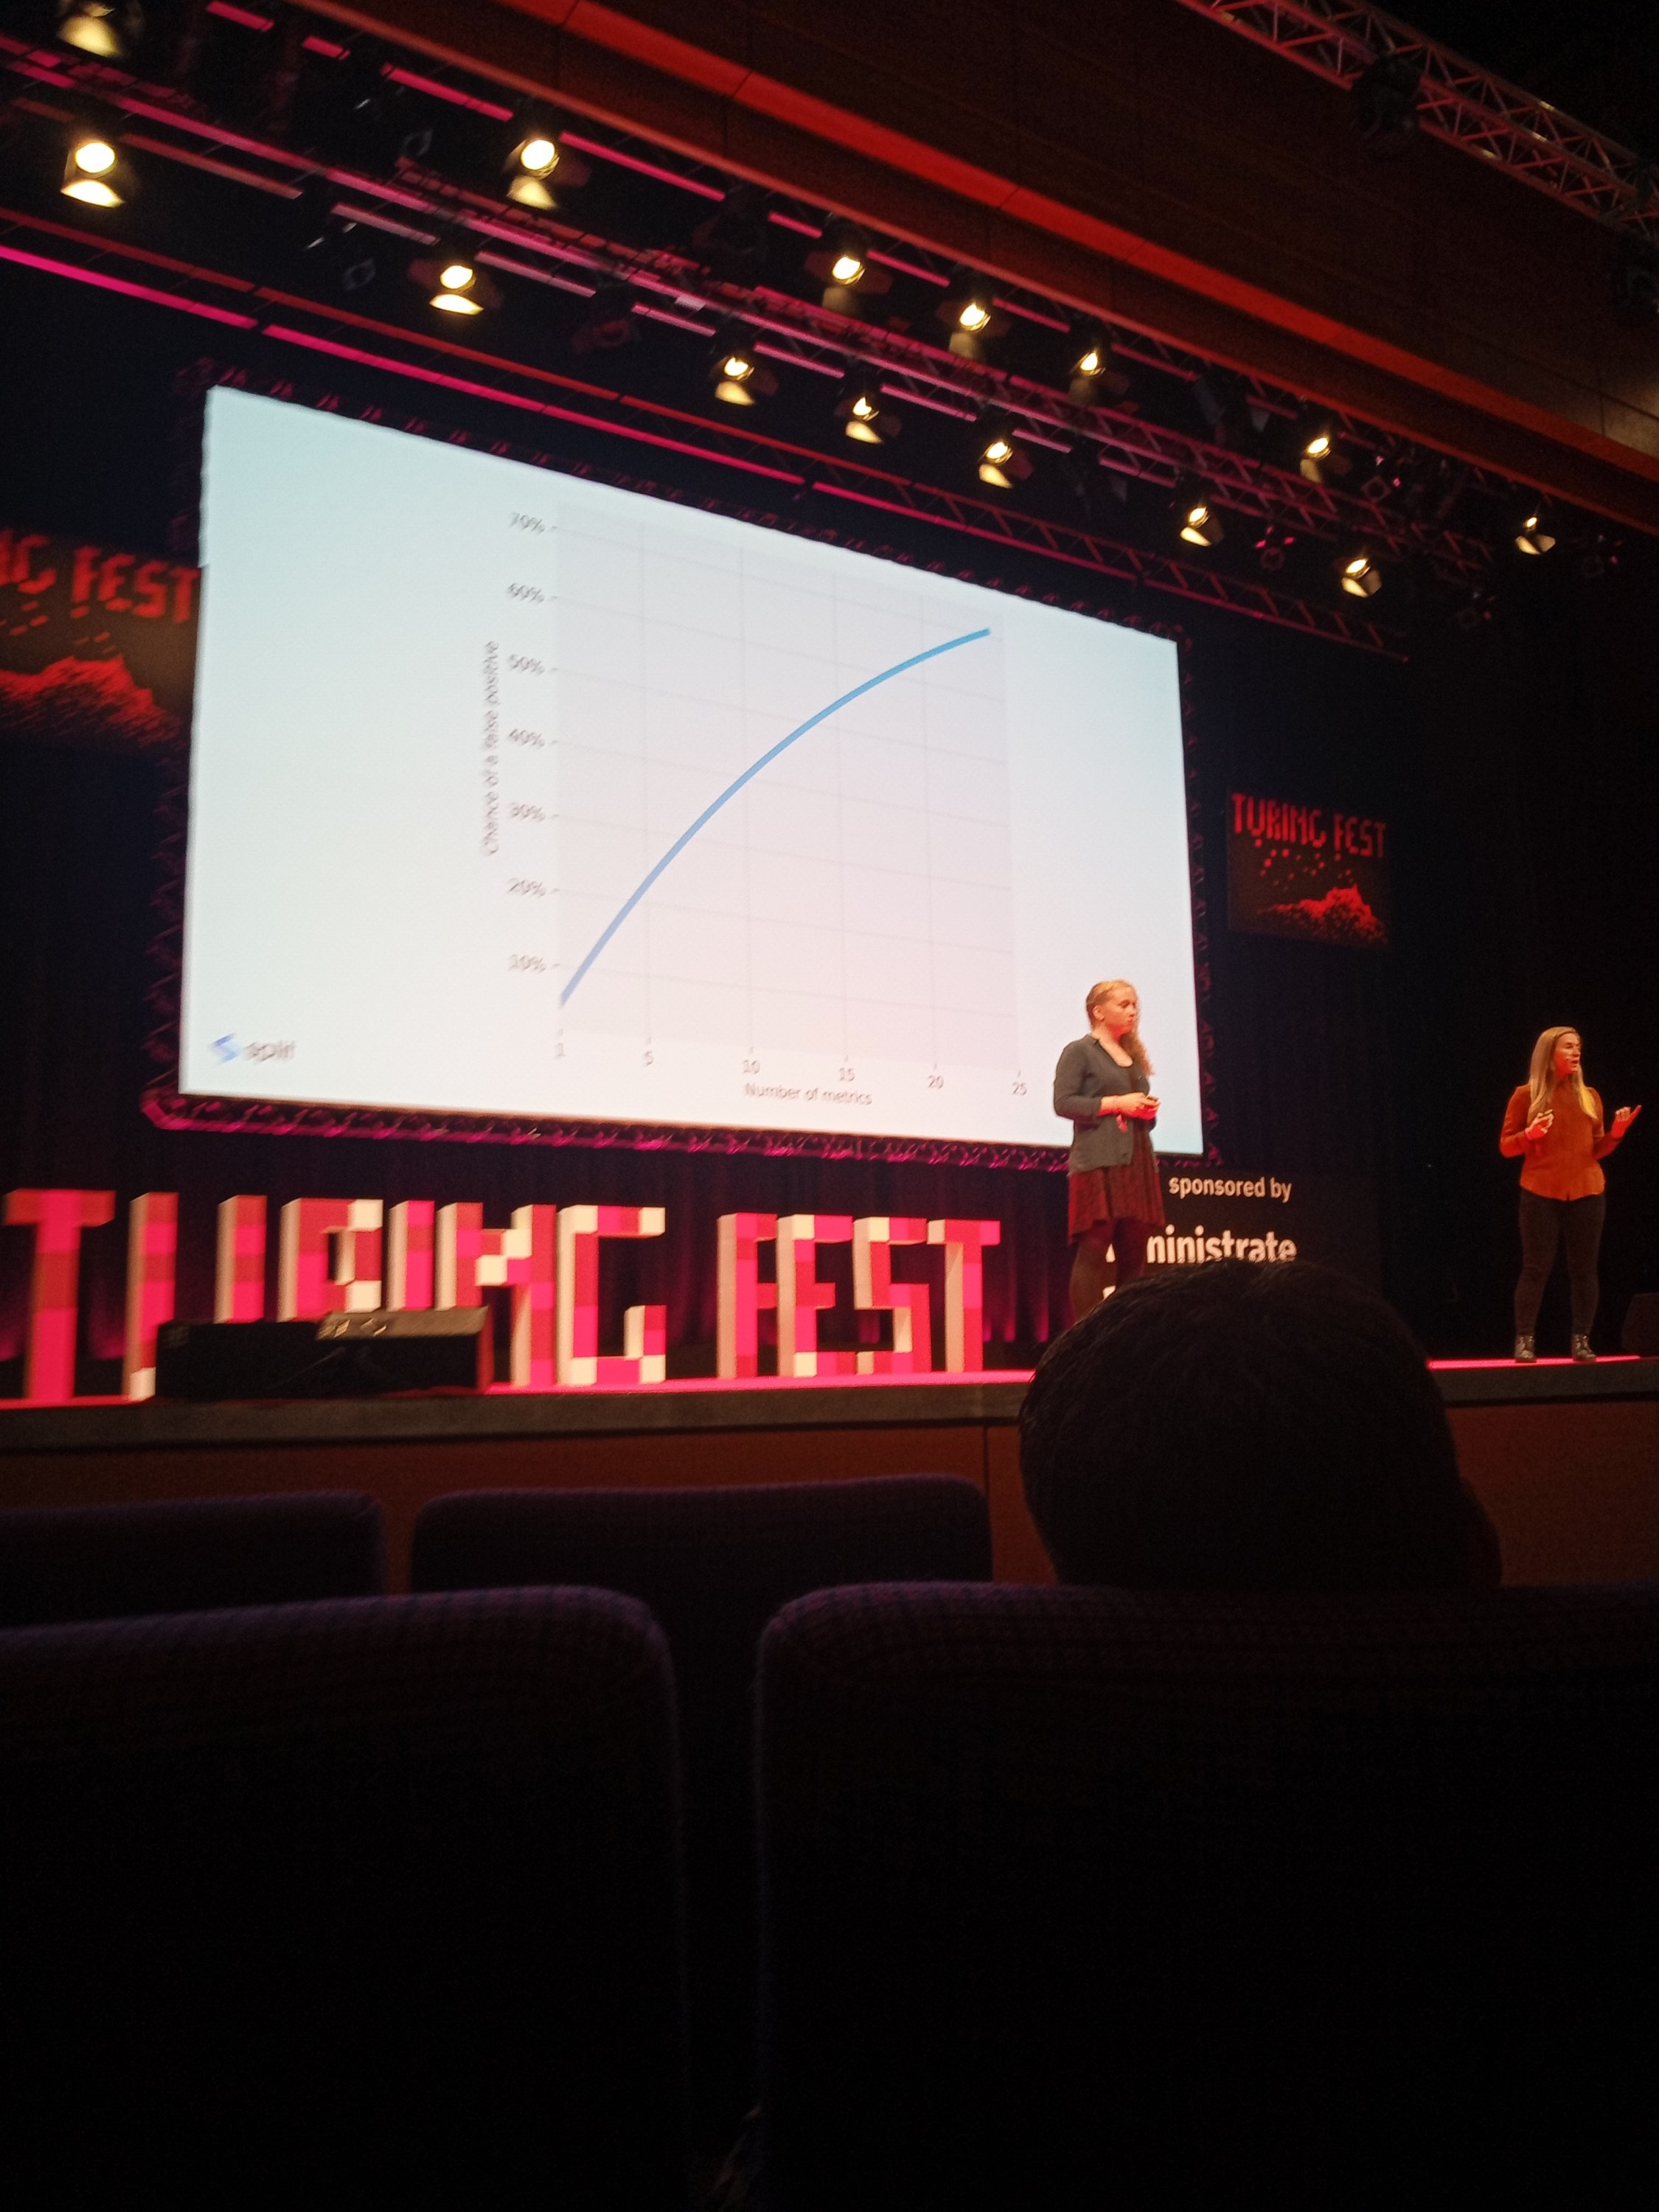
try to measure more than one thing, but not too many things
there are online calculators to show you the sensitivity of the experiment (eg how much of a change you can measure)
tools:
split
google optimise
a/b
etc
dont peek at the data while the experiment is running
analysis:
look for low p-values < 0.05
Leave a Reply
You must be logged in to post a comment.