Remote Debugging PHP in Brackets with XDebug prereqs:
This post assumes you already have:
- a working xdebug install
- Brackets
How to get Xdebug working with Brackets?
- Open Brackets
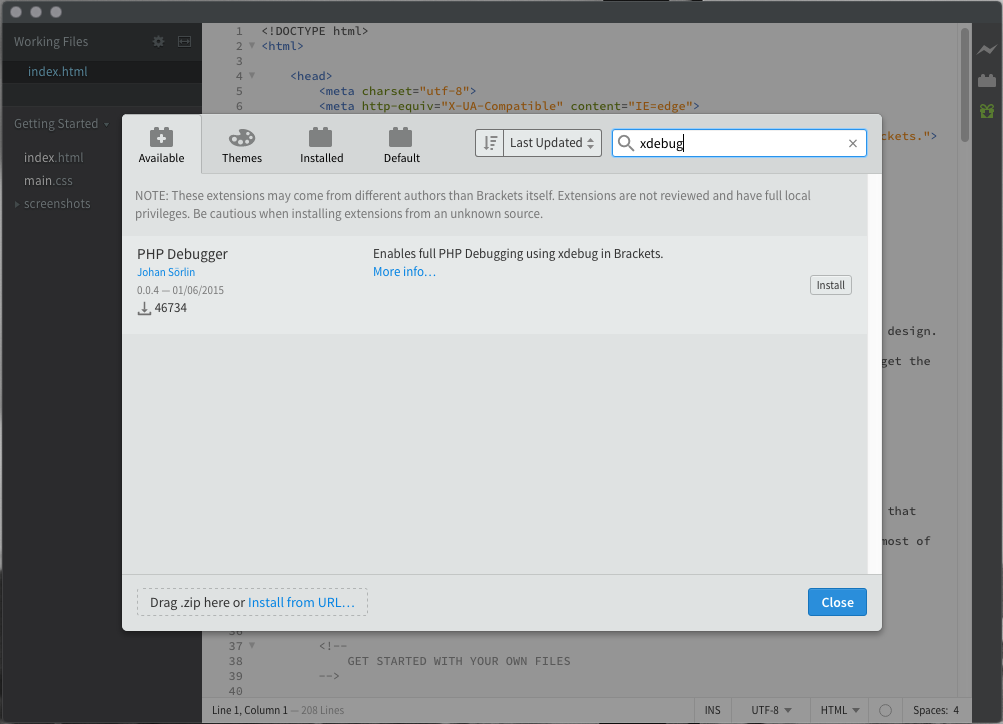
- Goto the extensions tab (the second icon on the right pane)
- Search for ‘xdebug’

- Click install
- Click close, click close again
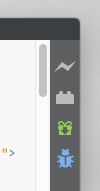
- Click the debug tab (looks like a blue bug, usually its the last icon in the
right pane)
- Make sure that you can see the message “Server started listening on port 9000” in the bottom panel

Setting Up Remote Debugging Paths
- Click the gear-icon
- Add the following to the “Listen for XDebug” section
"stopOnEntry": true,
"pathMappings": {
    "/var/www/vhosts/": "${workspaceRoot}/",
}
The exact path mappings will depend on your project
Click the ‘play’ icon (or press F5) to start the debugging session
PHP Step Debugging
To set a breakpoint, click on the gutter to the left of the line number

Remote PHP Debugging Using Brackets: Initiating a debug session:
Install the easy-xdebug instension in your browser:
Using Firefox
Xdebug Helper is the best solution I have found for firefox – simply install the extension from here,
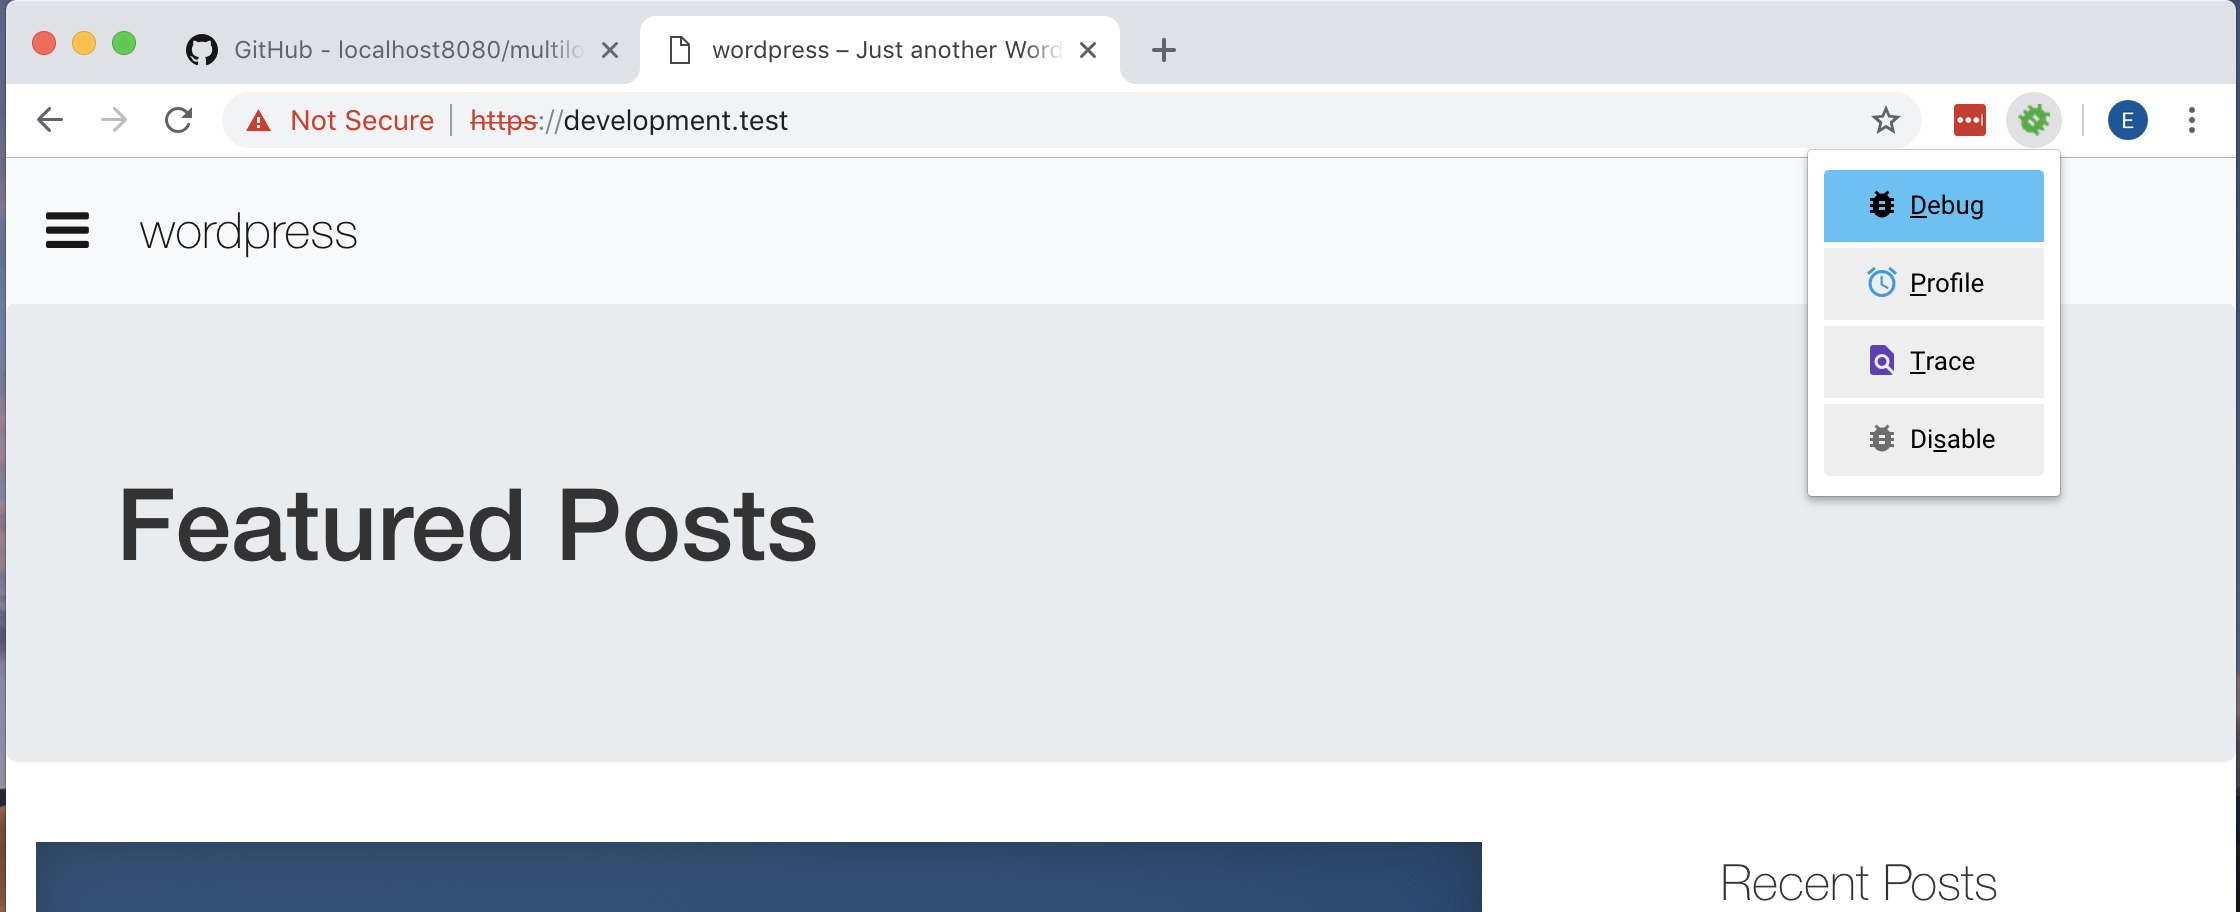
navigate to the site you want to debug, and click the little green bug, select debug and reload your page to open in your editors debugger.
Using Chrome
Xdebug Helper is the best solution I have found for chrome – simply install the extension from here,
navigate to the site you want to debug, and click the little green bug, select debug and reload your page to open
in your editors debugger.
lastly, navigate to the site you want to debug, and click the little green bug, select debug and reload your page to open in your editors debugger. You are now Remote Debugging PHP in Brackets with XDebug!


Leave a Reply
You must be logged in to post a comment.